This exercise takes an existing control system and walks through using the Software Fault Encouragement project tools (embrittle) to harden it against attacks. The control system was originally developed by Fathom5 for the HACKtheMACHINE event. The exercise is comprised of several parts including:
The goals of this exercise are to:
To start the Docker container, which contains all of the exercise material and tools, run the command:
docker run -it software-fault-encouragementThis command starts an instance of the container with an interactive shell. Next, change directories to the exercise code, which will be the focus of the rest of the session:
cd exerciseBeyond the required exercise materials and tools, the container also includes some common development tools including:
The control system is implemented in two parts: a C core and a Python watchdog and coordinator. The Python watchdog also acts as a simulated hardware endpoint for the demo, receiving commands from the control system core. Note that the C core has been written to be vulnerable to a number of exploits for ease of exposition and due to its original purpose as a target in a Capture the Flag (CTF) event at a hackathon. The core control system was designed to control a set of LEDs. In the CTF event, the participants goal was to hack the system to turn on the LEDs.
The core control system files are:
The watchdog and coordinator code is implemented in splash.py, which runs the core C controller code, provides it with inputs, and consumes its outputs (i.e., hardware control actions). The watchdog takes a list of executables to run as command line arguments, and runs all of them.
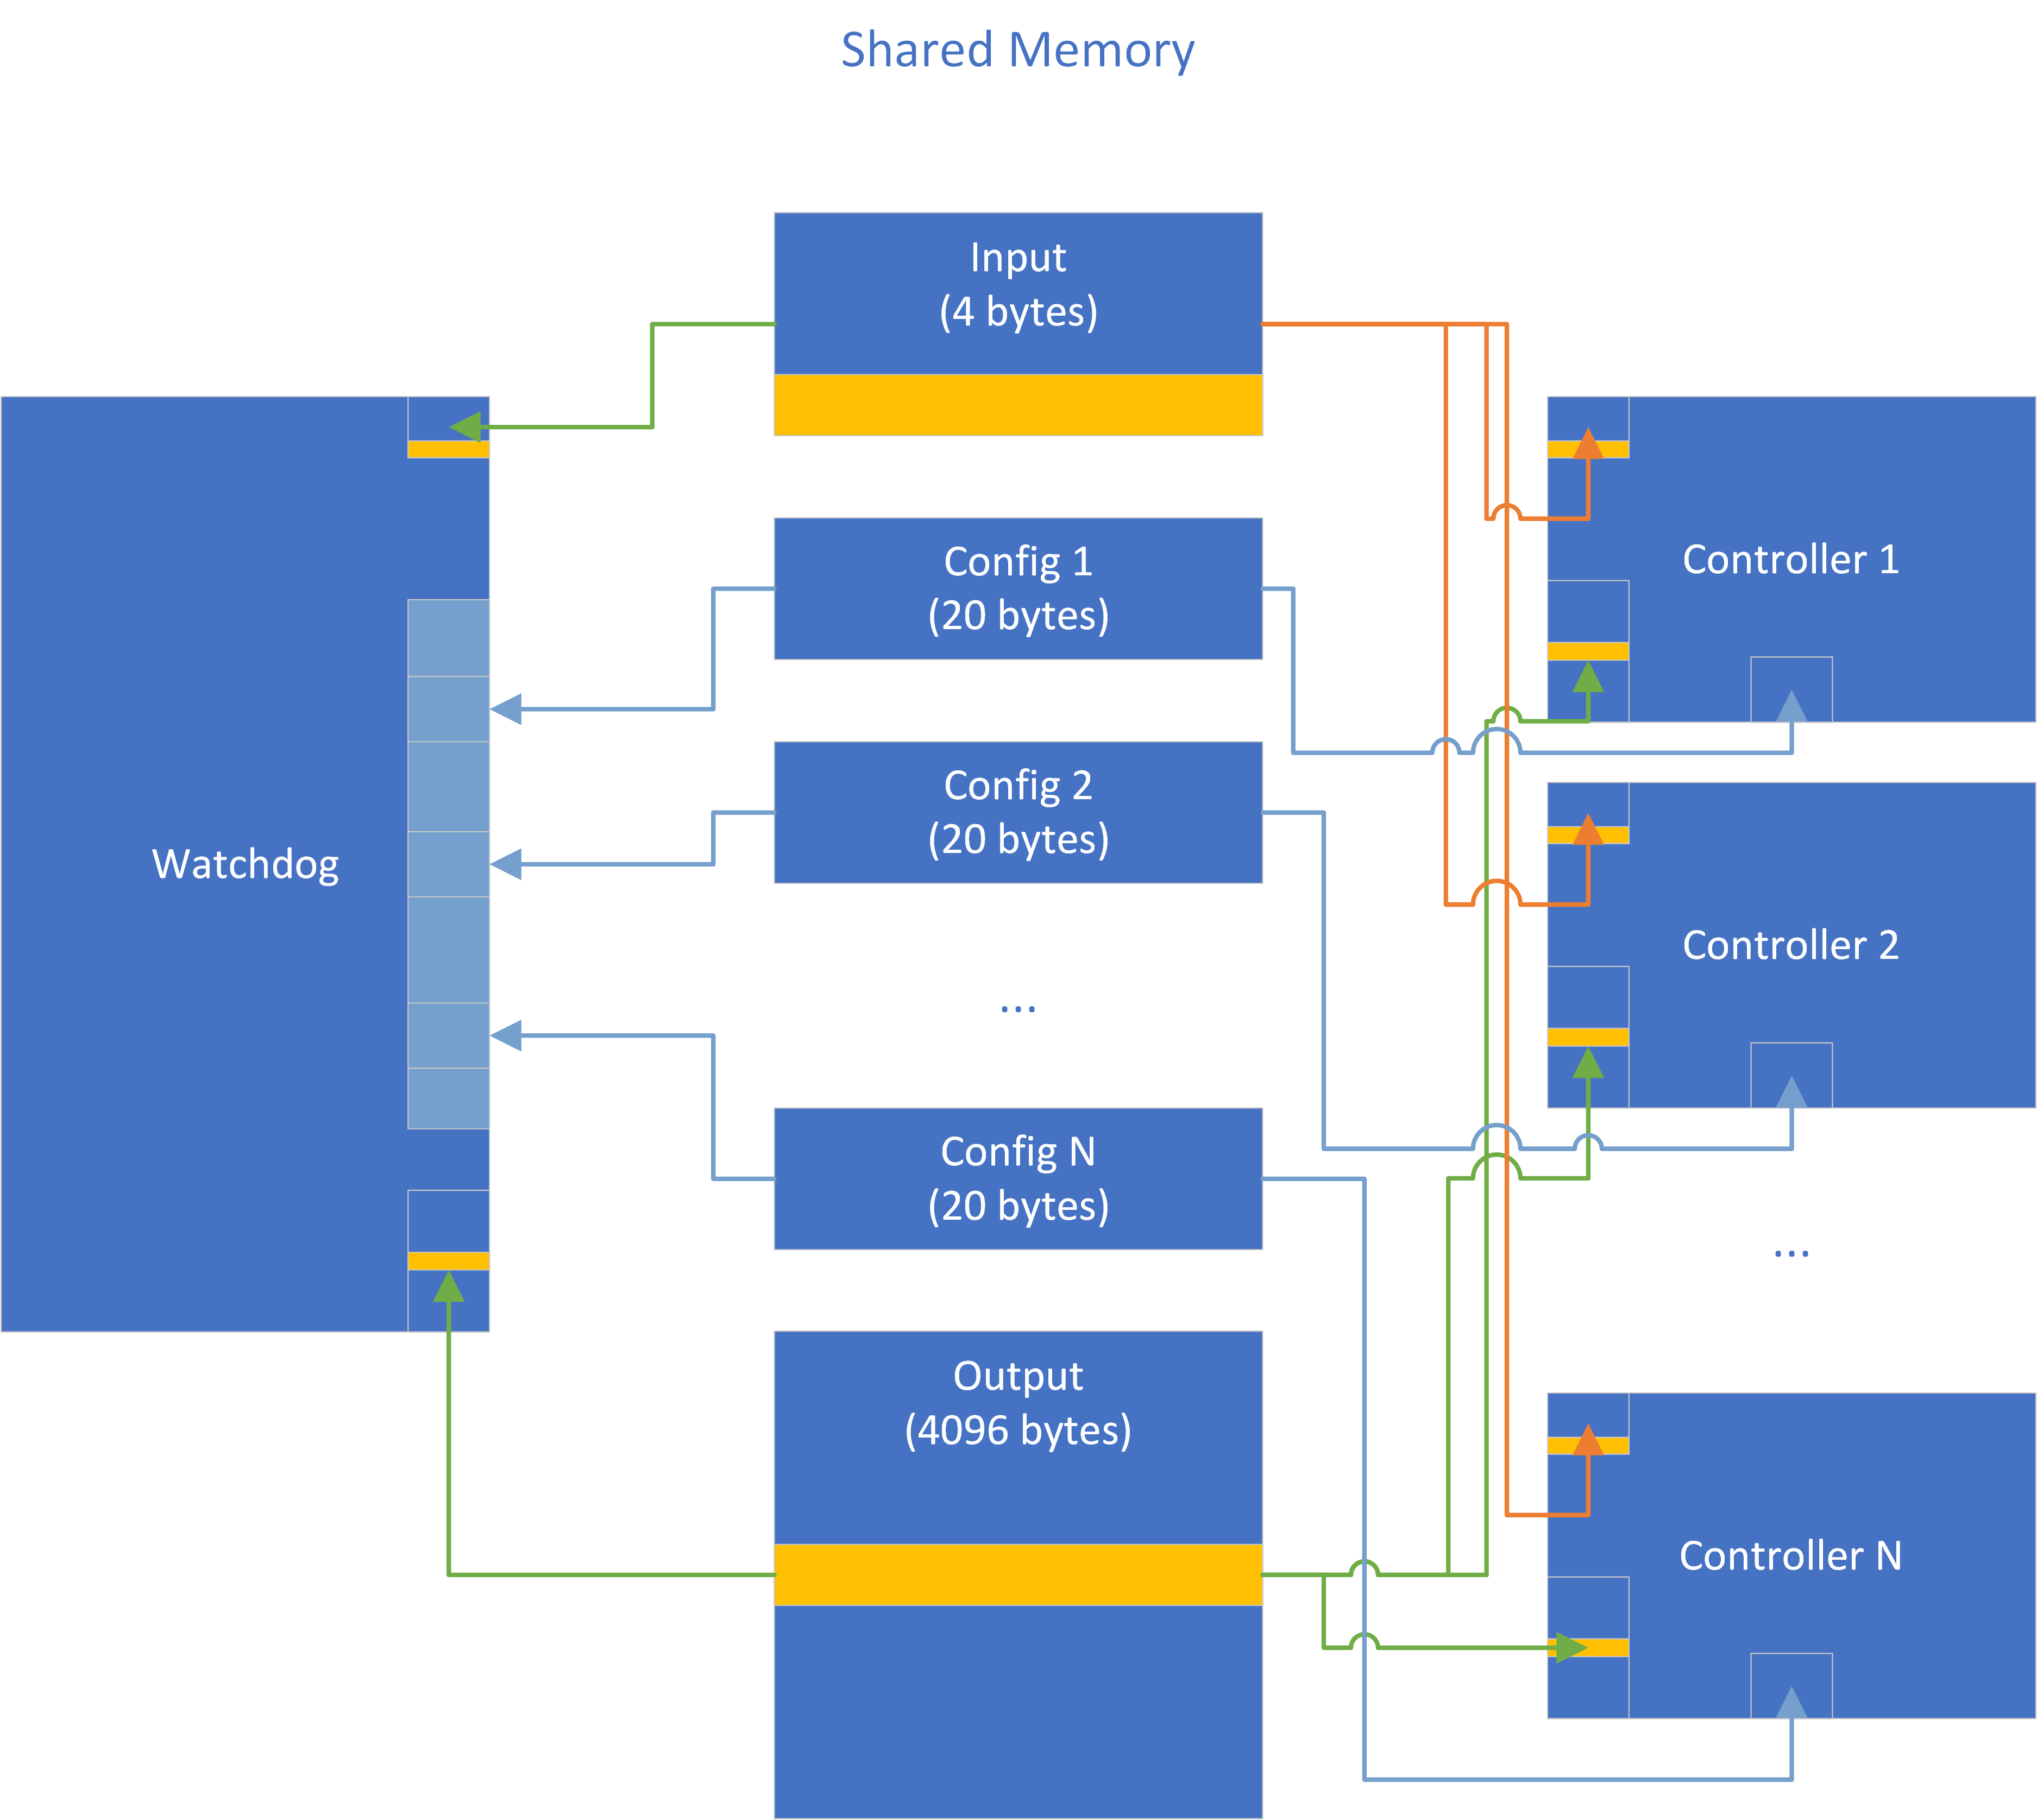
The watchdog communicates with a number (N) of controller instances via shared memory. Each controller process has access to three pieces of shared memory:
This arrangement is depicted in the Controller Architecture diagram below:
Note that the yellow highlighted sections of the input and output regions are connected to the simulated hardware. The input has only a single analog input represented as a uint32 simulating an input voltage (it has interesting behaviors around the values 100 and 150). The controller outputs that affect the hardware interface have 7 pins; the pin layout of the hardware device is depicted in the Controller Configuration diagram, below. Note that the output memory area is significantly larger than the pin count would indicate. This design is in support of I/O multiplexing across all of the running controllers.
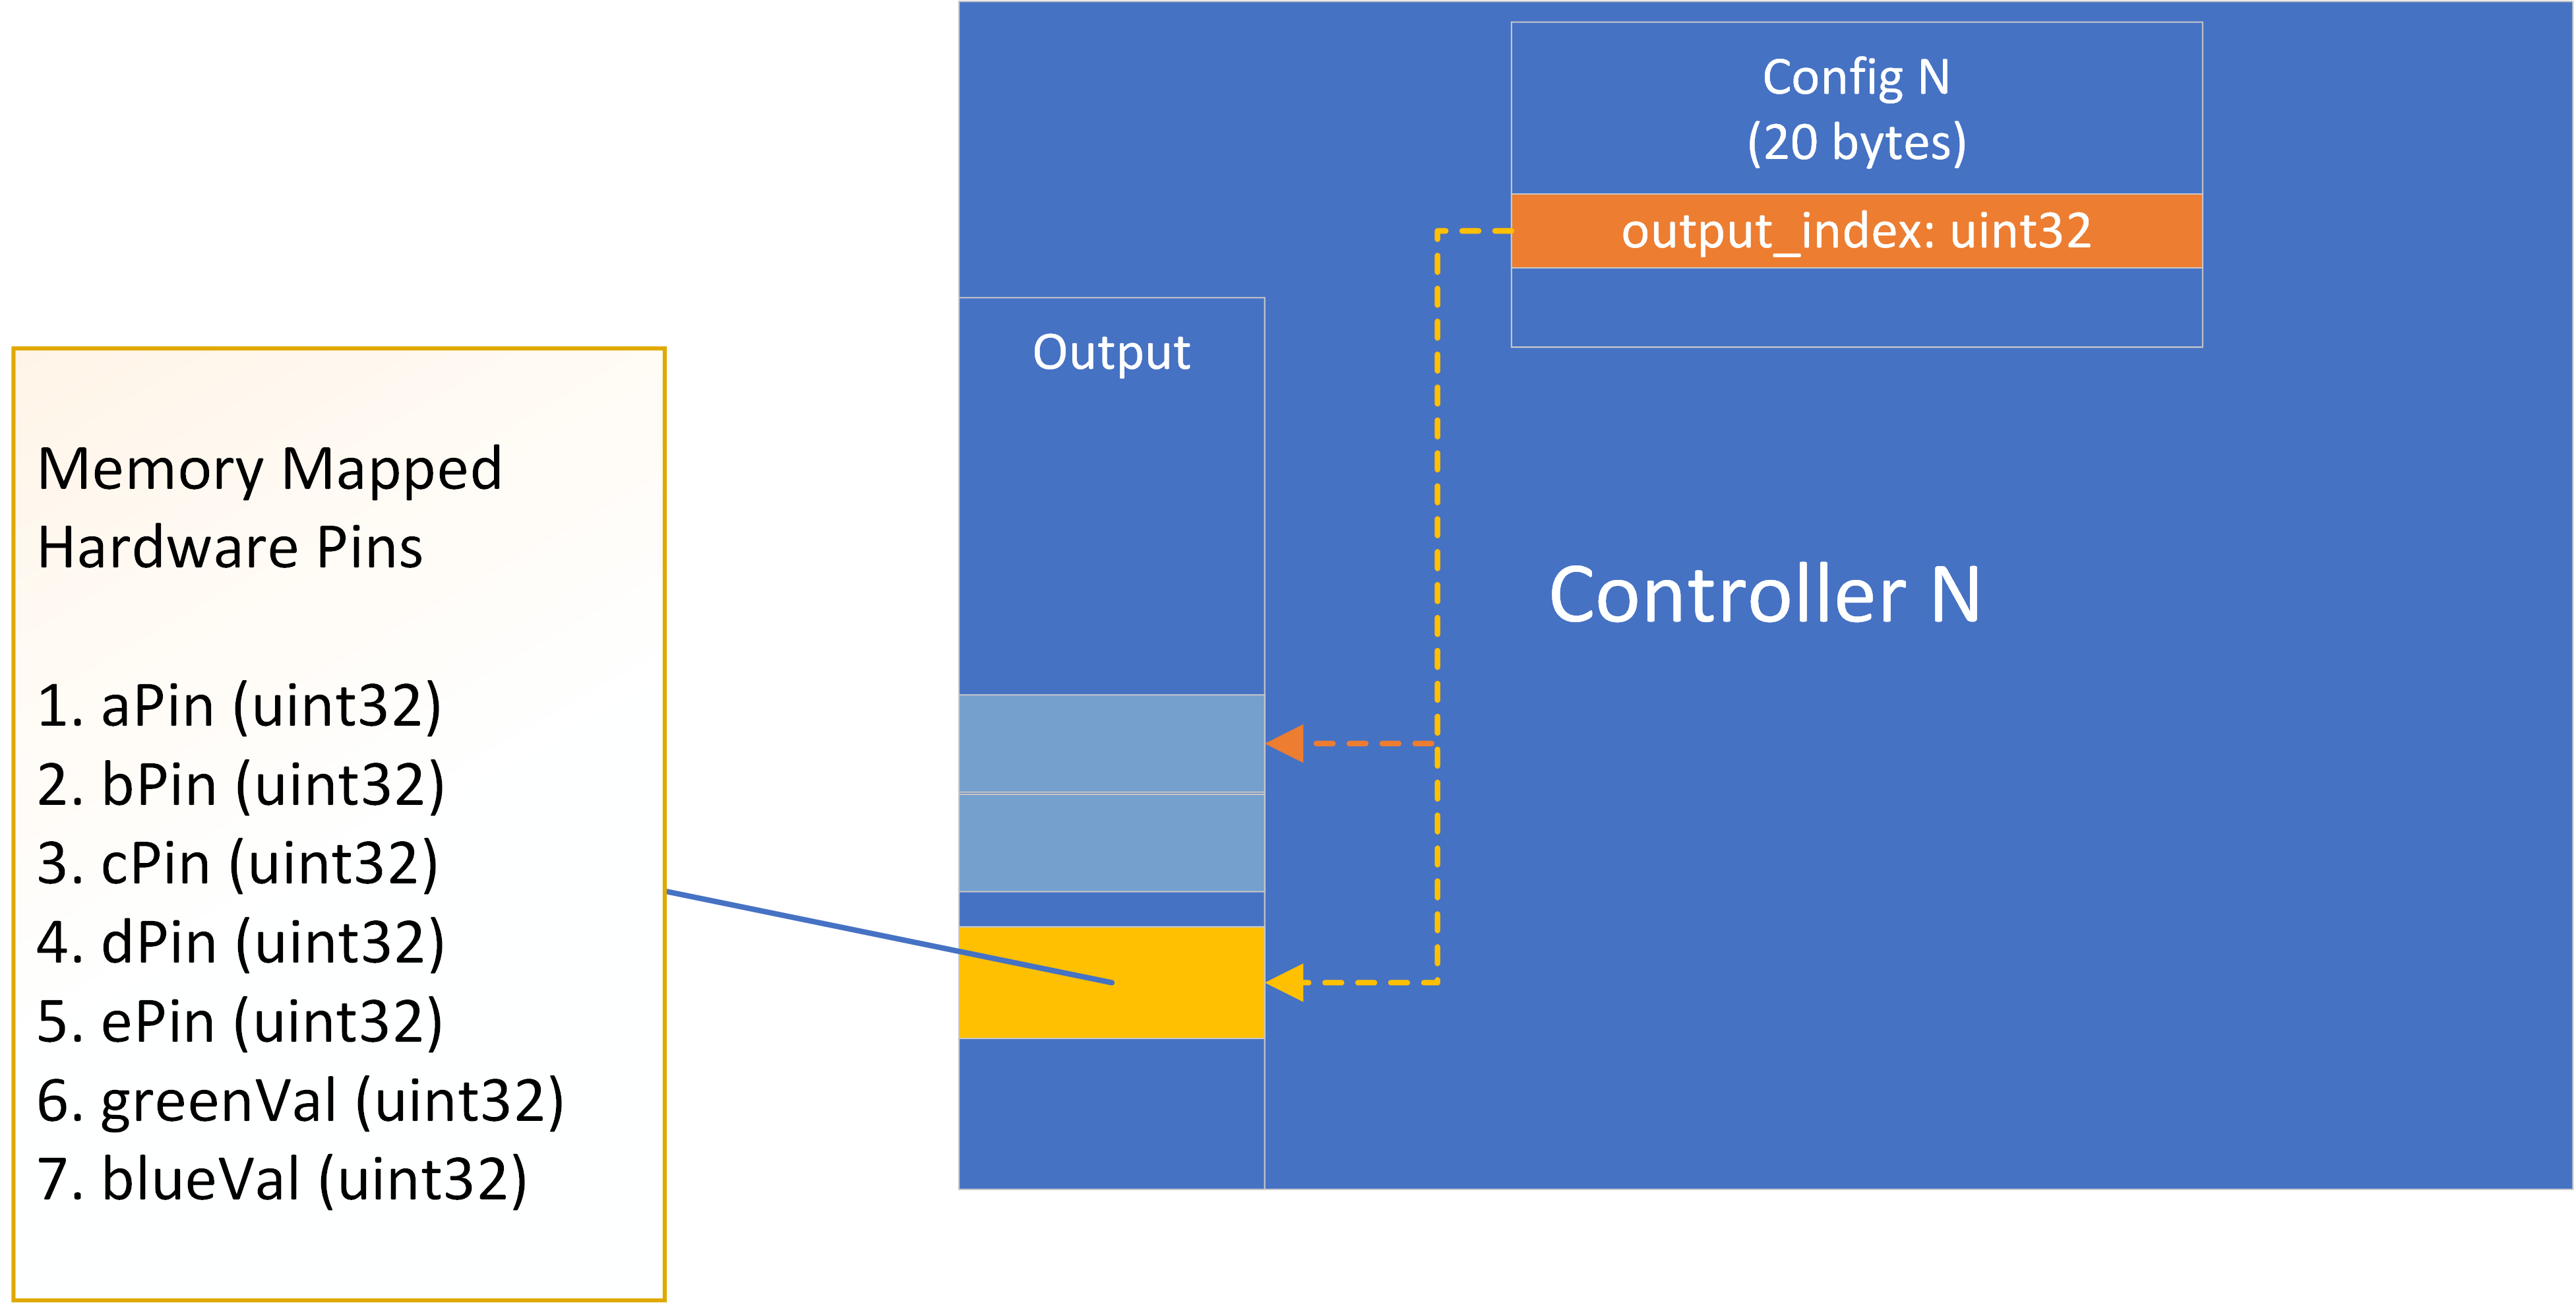
The simulated hardware has 7 memory-mapped I/O pins. Each of the a-e pins determines if its corresponding LED is on (1) or off (0). The green and blue pins control the color of each of the a-e LEDs, and can take arbitrary uint32 values. At any given time, the watchdog arranges for a single controller instance to be writing to the real I/O block, while the others write to other locations in the large output memory region that is shared among all controllers. When the controller connected to the real outputs crashes, the watchdog arranges for another controller to take its place. The watchdog implements this control via the third, private, configuration shared memory region. The configuration region, as depicted in the Controller Configuration diagram, has a uint32 output_index, which is an offset into the output array to which the controller should direct its output. The private configuration region also contains a few file descriptors to support console I/O capture of the controllers and a notification channel back to the watchdog, but these are not crucial for a high-level overview.
Additional notes:
The standard input control channel is not shared among all controllers: each controller has its own standard input. Each controller accepts commands over standard input:
Lines beginning with:
1 causes the characters after 1 to be copied into a small buffer (which is useful for setting up ROP attacks)2 prints the contents of that internal buffer to standard output3 launches a fatal code injection attack against the process4 launches a non-fatal code injection attack against the process (but note that the attack takes over and prevents the controller from working)The watchdog, implemented in splash.py, has two main components:
Watchdog class, which implements the majority of the watchdog logicController class, which encapsulates the functionality related to managing a single controller instanceThe watchdog and controllers are instantiated in the main function. There are also a number of helper classes implementing the user interface: ControllerStatusWidget, CanonicalStateWidget, and LogWidget.
To start the system with a single controller instance, run
./splash.py ./splash.exeTo start the system with two controller instances, run:
./splash.py ./splash.exe ./splash.exeThe watchdog provides a simple Terminal User Interface (TUI) to interact with the system. The TUI looks like the following:
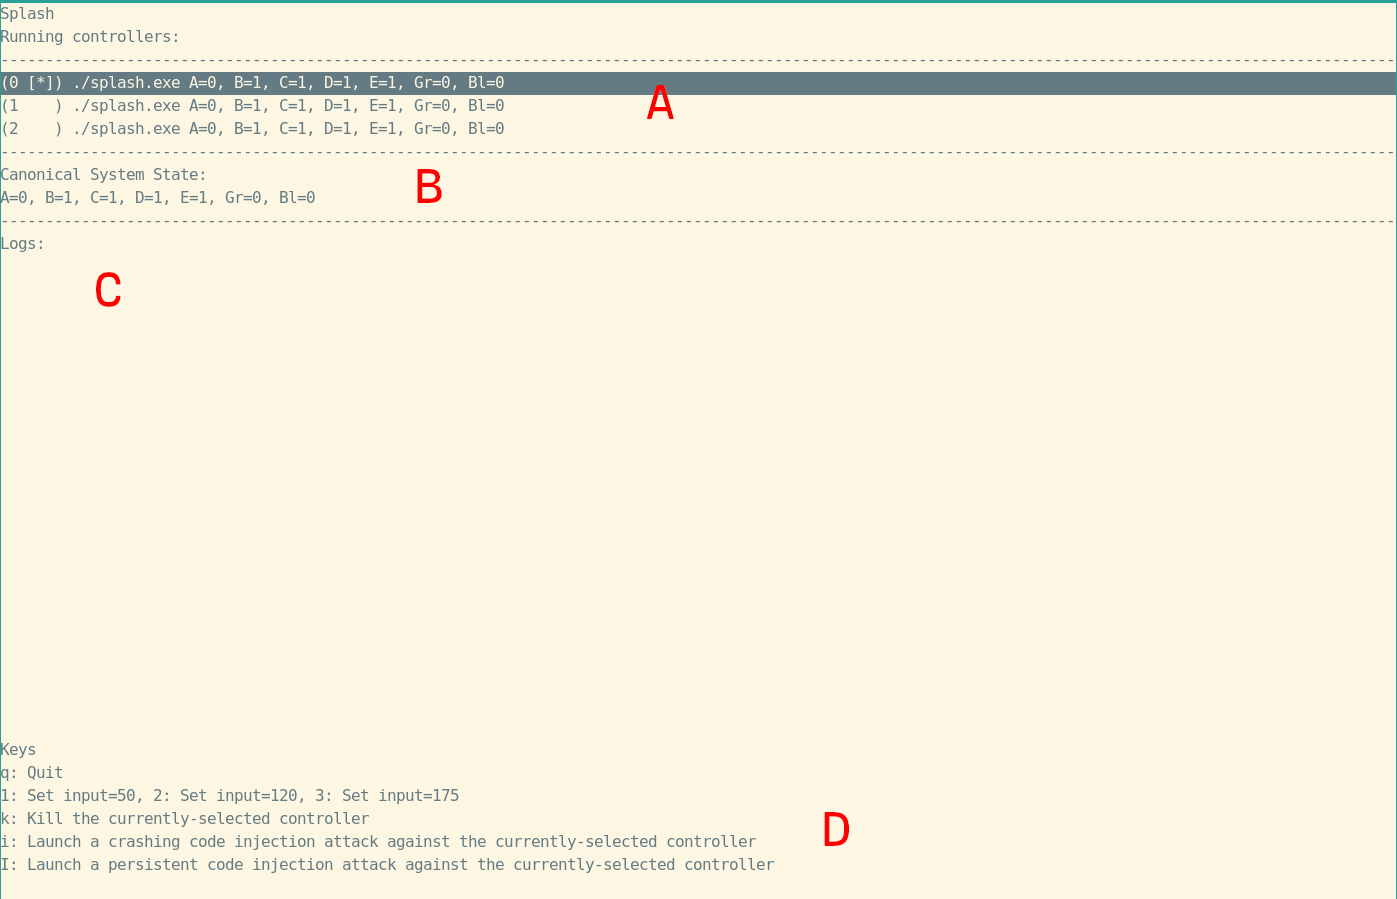
The user TUI is divided into 4 areas (marked A-D in the screenshot):
A. The current state of all of the controller processes including:
B. The canonical state of the system, reflecting the state of the chosen active controller
C. System logs, including notifications about state changes and output collected from each controller variant
D. A description of the available keybindings.
This exercise adapts the control system to use multiple diversified variants to add resilience against cyber attacks. As the control system has been designed to be vulnerable to attacks, we will start by demonstrating an attack and then adapting the watchdog process to mitigate the attack.
First, start the system with one or more copies of the splash.exe controller running:
./splash.py ./splash.exe ./splash.exeModify the system state with the 1, 2, and 3 keys to observe its behavior. Observe the effects of killing controller processes with the k key, or launching code injection attacks with the i and I keys. Note that if your pool of controllers is exhausted, simply quit the watchdog with q and restart.
Note that the exploit is a code injection attack (the details can be seen in splash.c). The injected code runs the command ls /; the i variant of the attack proceeds to crash the controller, while the I variant of the attack takes persistent control of the controller, preventing the watchdog from noticing that it has crashed.
We’ll now mitigate the attack by introducing artificial binary diversity and additional attack mitigations. Use the embrittle tool to generate a number of variants. Some useful options to embrittle include:
--variant-count INT--mapping FILE--layout-random-o,--output FILEHowever, many of the other options will also be interesting and useful.
embrittle splash.exe -o splash.exe.brittle --layout-random --mapping splash.exe.brittle.mapping --variant-count 4

# Alternatively
embrittle splash.exe -o splash.exe.brittle-p --layout-parallel --mapping splash.exe.brittle-p.mapping
embrittle splash.exe -o splash.exe.brittle-r1 --layout-random --mapping splash.exe.brittle-r1.mapping
embrittle splash.exe -o splash.exe.brittle-r2 --layout-random --mapping splash.exe.brittle-r2.mapping
After generating a set of variants with the --mapping flag, use the visualization tool to examine the effects of diversification:
visualization -p 5000 *.mappingThe visualization tool starts a webserver at the provided port (5000 in this case). To see the visualization, visit http://localhost:5000. The visualization shows the diversity introduced into a binary, and also provides a tool for evaluating the residual risk in a binary represented by gadgets that have not moved between variants.
Start the system using the generated variants instead of the original binary:
./splash.py splash.exe.brittle*Now re-trigger the exploits with the i and I keys. The expected result is that a variant may crash, but the exploit should not trigger completely (i.e., you should not see the ls output observed when the attack worked). Also observe that the system still runs, as the watchdog fell back to another running variant.
Note: You can skip this step if you would prefer to edit code directly in the Docker container using e.g., vim or emacs.
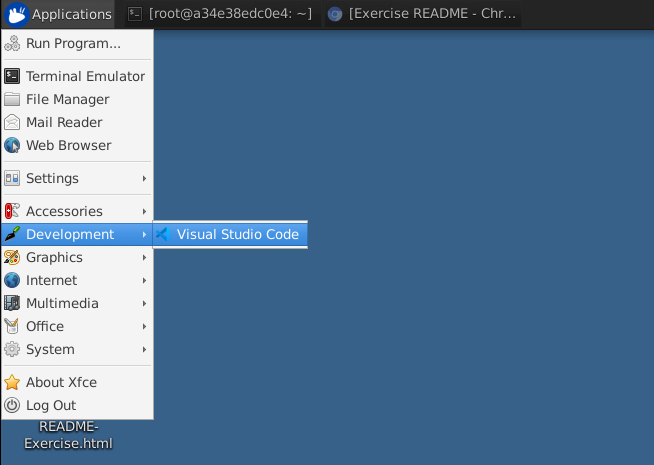
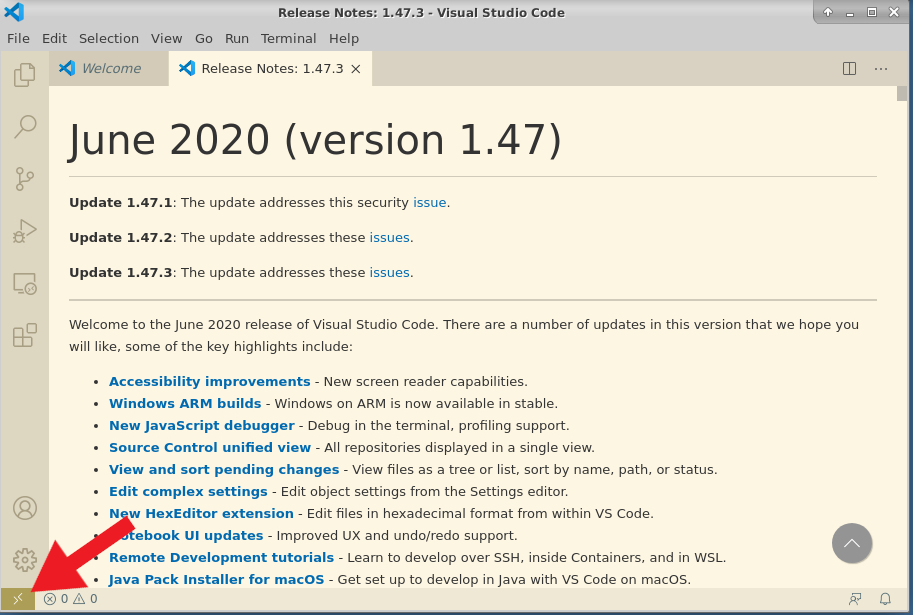
The rest of the exercises will give an idea of what level of effort is required to best take advantage of the benefits of brittle software (as implemented by Software Fault Encouragement). They will focus on modifying the watchdog (splash.py). The recommended tool for making the necessary modifications is Visual Studio Code, which is able to modify files in the running Docker container in a convenient way. To start VS Code, open the Applications menu in the upper left corner of the screen and navigate to Development > Visual Studio Code.
Next, we will connect VS Code to the running container instance. To do so, click on the icon in the lower left-hand corner of the VS Code window:
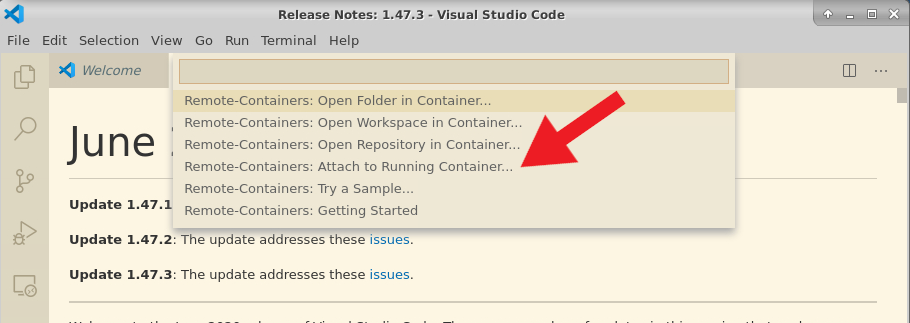
This will open a menu off of the quick bar at the top of the screen with a few options. Select “Remote Containers: Attach to Running Container…”:
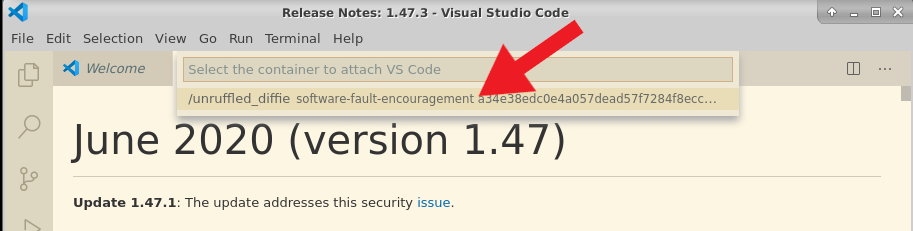
This will open a secondary prompt with the running containers. There should only be one, for the software-fault-encouragement container. The name of the container may differ, but the image name (the second component) should be the same.
Clicking on the container name will open a new instance of VS Code attached to the container and able to view and modify its contents. At this point, you can close the first window, if desired.
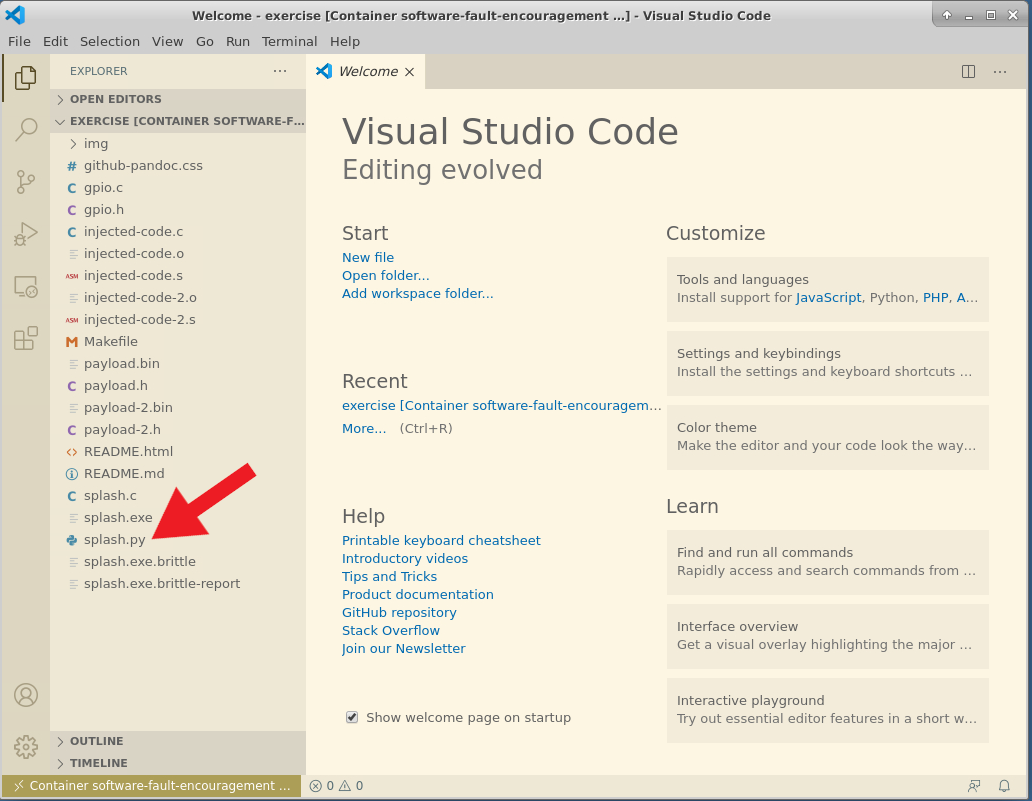
The VS Code instance attached to the container should display a sidebar with the contents of the exercise. Open the file splash.py by clicking on it.
In the third step of the exercise, an exploit was able to bring down a variant. If that exploit runs repeatedly, it could bring down all of the variants and cripple the system. We will next adapt the watchdog to restart crashed controller processes and keep them as hot spares.
To restart processes, we want to periodically check if there are any crashed controller processes and, if there are, restart them. We can do this by starting an additional thread to execute this periodic check and restart action. We will do this in three steps:
There is an example implementation in the watchdog, which starts off commented out. To enable this feature, uncomment the functions marked as “NOTE: Uncomment for Task 4”:
restartCrashedControllers in the Watchdog classrestartCrashedControllers the top-level functionrestartCrashedControllers in the main functionNote that the code is written in Python, which is an indentation-sensitive programming language. When uncommenting these code blocks, ensure that whitespace is preserved by deleting both the # and the space after the comment character. An easy way to accomplish this in bulk is to highlight the indicated code and use the “Toggle line comment” function (bound to key Ctrl+/).
At this point, the watchdog monitors controller processes and restarts them periodically after they crash. However, all crashes look the same to the watchdog; it is unable to distinguish between transient faults and determined attacks. This exercise will walk through the process of using advanced features of the embrittle tool to increase the amount of information that the watchdog process can learn from crashed controllers. The modification will have two steps:
embrittlesplash.py) to consume and display the additional informationTo accomplish the first step, we will use the --reporting-address ADDR option for embrittle, which generates binary variants that write a distinguished pointer-sized value to ADDR when an attack is detected. If the watchdog process arranges for the provided address to be mapped in memory shared between the controller and the watchdog, the watchdog will be able to observe when controllers self-report attacks. Recall from the controller architecture description that there are three shared memory regions in each controller:
It so happens that the configuration block is mapped as writable by the controller, and has space that could be used for communication. The diagram above shows the most important (first) field of the configuration block: a uint32 that tells the controller which offset into the output block it is to write to. There is actually some additional information in this structure to facilitate communication between the watchdog and the controller processes. The full structure is defined in splash.c on line 71. Its definition is:
struct block_selection_t
{
  /// The index into `pinBlocks` to write outputs to
  uint32_t pinBlockIndex;
  /// A pipe for the controller to write to, to inform the watchdog that it has
  /// produced output
  int notify_fd;
  /// A file descriptor to dup to stdin (since we read commands off of stdin)
  int stdin_fd;
  /// A file descriptor to dup to stdout
  int stdout_fd;
  /// A file descriptor to dup to stderr
  int stderr_fd;
};
The file descriptors in this structure are passed from the watchdog to the controller processes so that the watchdog can capture their console output (which is displayed in the TUI) and send commands over standard input. However, after each controller process is set up, the values in this structure are no longer required. We can re-use them to report attacks from the controller to the watchdog. As noted in the controller architecture overview, this control block is mapped at address 0x777771000. The attack reporting code writes 8 bytes, which we would prefer to be aligned. We cannot overwrite the pinBlockIndex, but we could overwrite stdin_fd and stdout_fd, which implies that the attack reporting address should be 0x777771008.
embrittle splash.exe -o splash.exe.brittle --layout-random --mapping splash.exe.brittle.mapping --variant-count 4 --reporting-address 0x777771008Now that we have a set of variants that report attacks, we will modify the watchdog (splash.py) to observe attack reports and display them in the TUI. We can do this in three steps:
As in Task 4, there are example implementations commented out in splash.py.
The first item can be found in the Controller class as the checkReportedAttacks method. This function reads the current value in the shared memory region at the address we have chosen for attack reporting and compares it to the original value that was in place when the process was started. If the two differ, an attack has been detected. The suggested implementation records detected attacks in a field of the watchdog.
The second item can be found in the Watchdog class in the updateState method. This method is called whenever the watchdog updates its state in response to changes in the states of the controllers. The implementation iterates through each controller and records any reported attacks.
The third item can be found in the CanonicalStateWidget. This widget displays what the watchdog considers to be the state of the system, based on the outputs of the primary controller. The suggested change displays reported attacks, if there are any.
Note that this implementation has the important property that attack notifications persist after controllers crash.
Depending on the architecture of your controllers or watchdog, variations on this approach may be required.
During the main exercise we made no modifications to the controller itself (splash.c) because no changes are necessary to the control system itself. However, if you would like to modify the control system to experiment, the included Makefile will rebuild it.